A very common arrangement in the past was to have a somewhat independent kingdom paying tribute to an empire. I judge these arrangements based upon the actual power relationships.
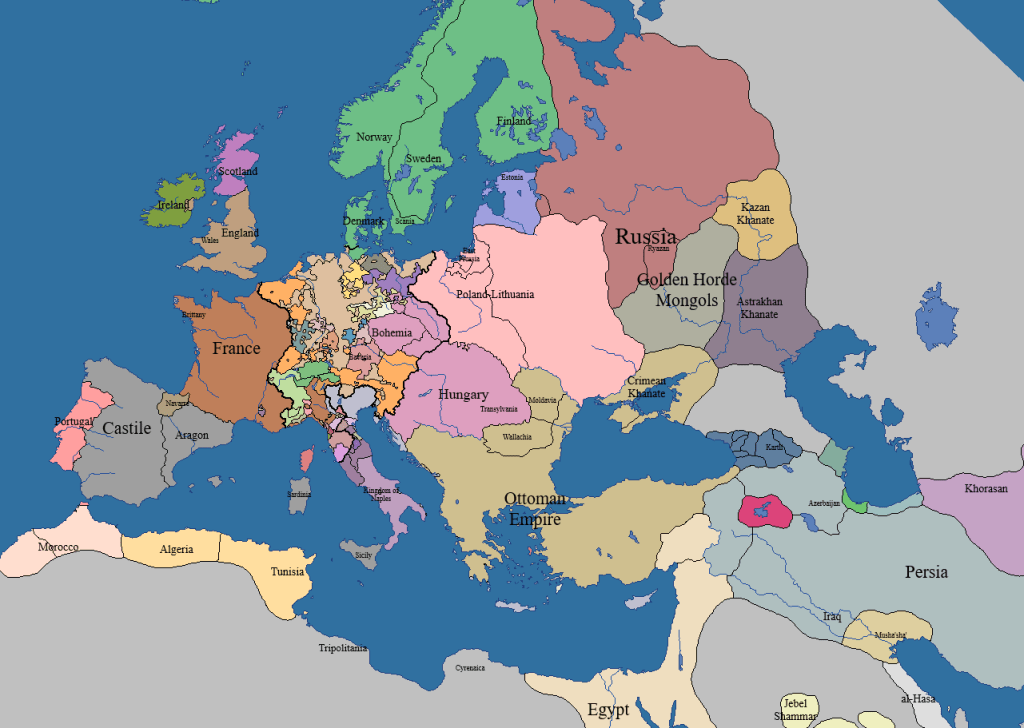
For example, Wallachia paid tribute to the Ottoman Empire from 1420’s on, but there were frequent refusals of tribute and wars with the Ottomans until the Ottormans finally consolidated control in 1715. On the other hand, the client states of the Roman Empire were fairly stable in their relationships.
Chinese empires usually had a system where kingdoms paid “tribute” and were given “gifts” on what was effectively a state-managed trade system. These kingdoms were clearly independent.